| North American Regional Climate Change Assessment Program |


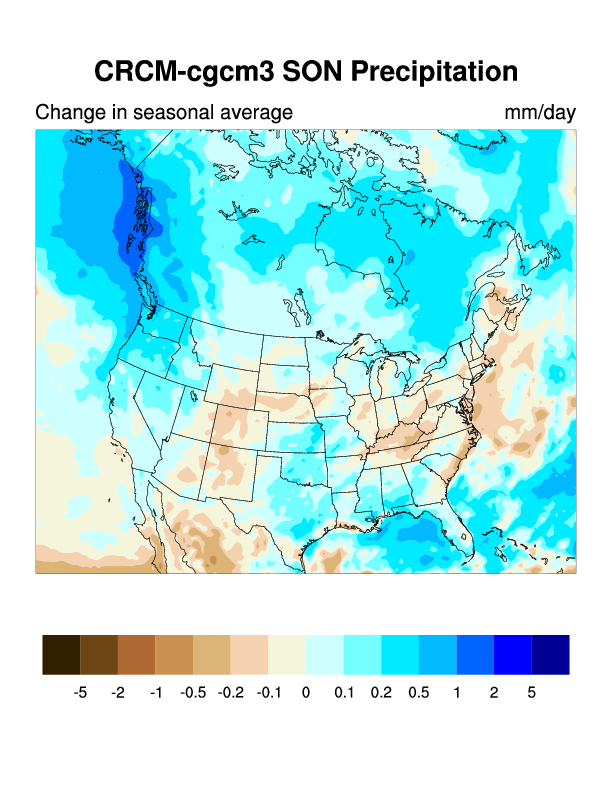
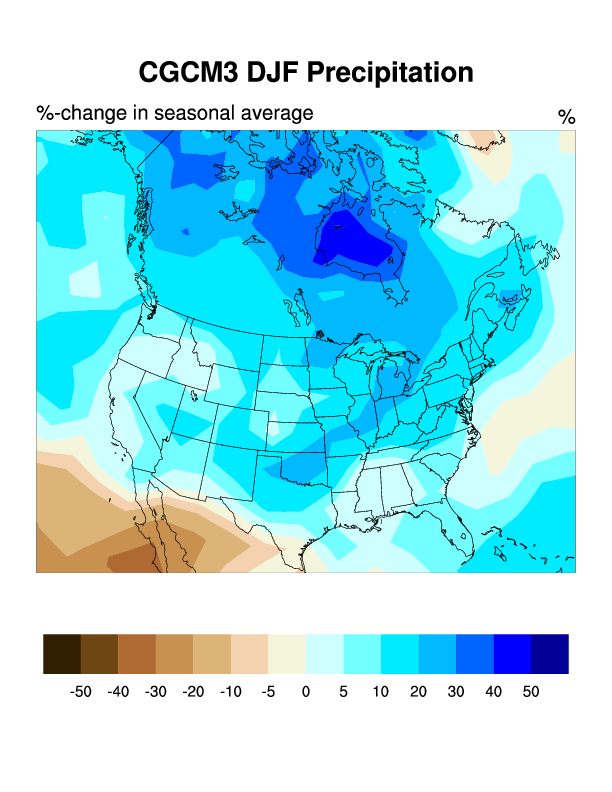
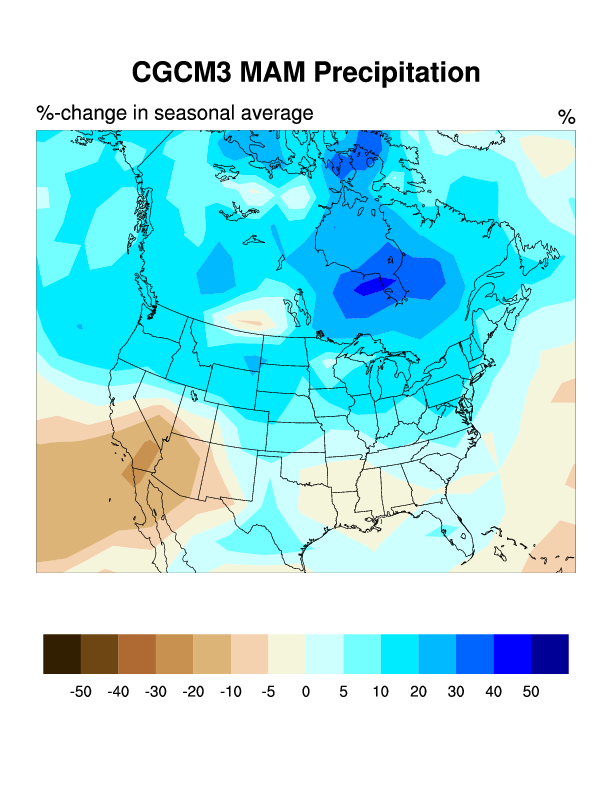
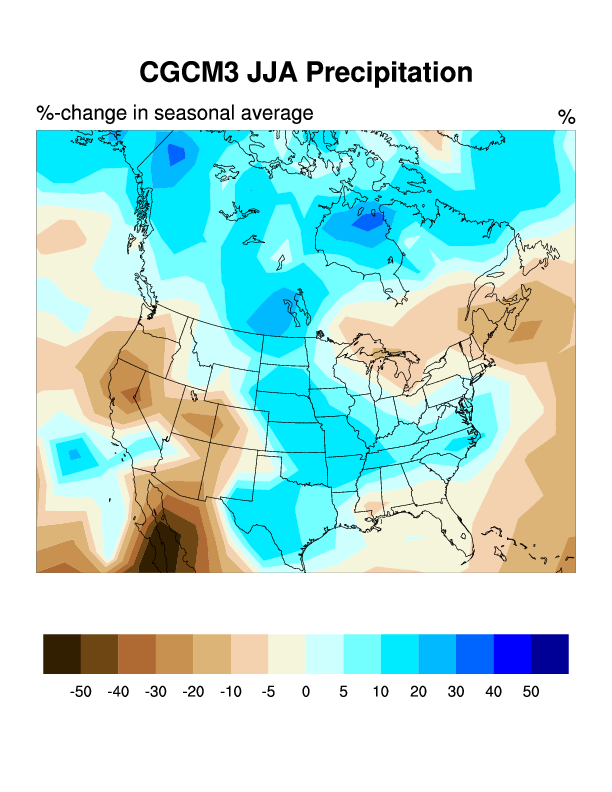
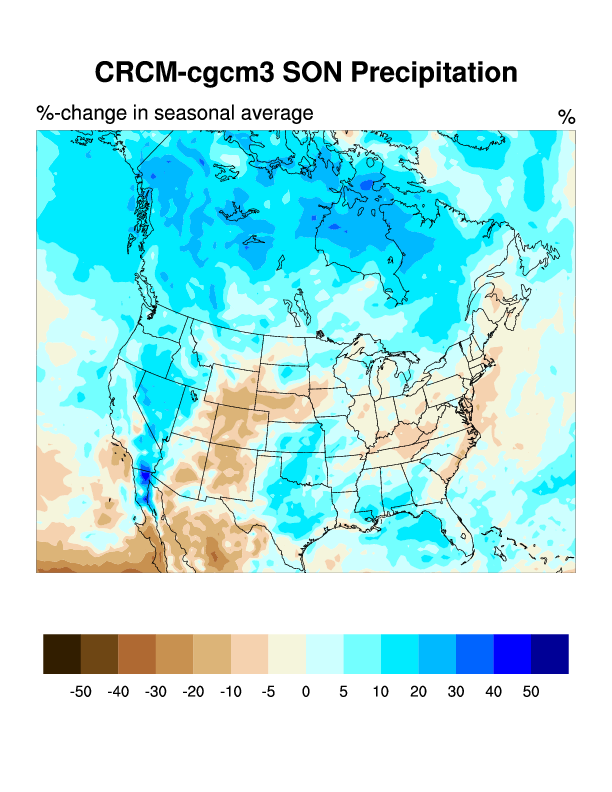
| CRCM+CGCM3 - Seasonal Climate Change | ||||||||||||||||||||||||
|
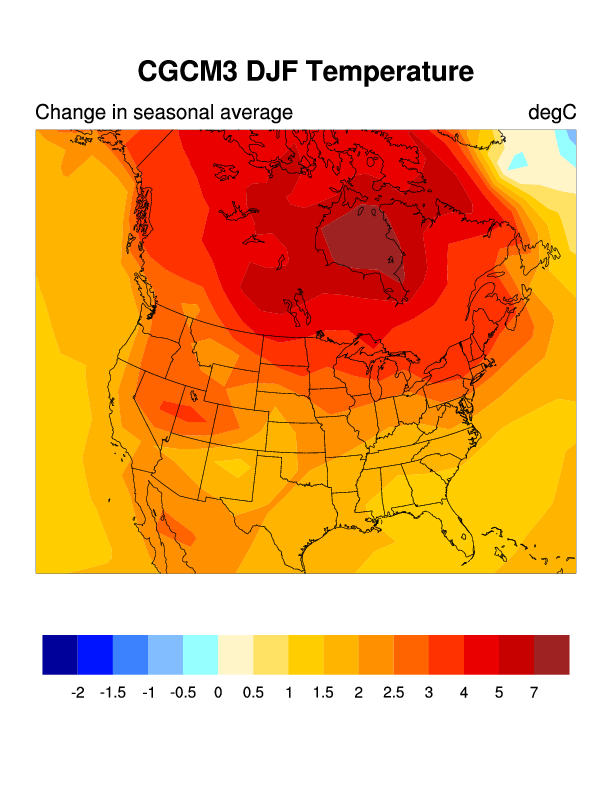
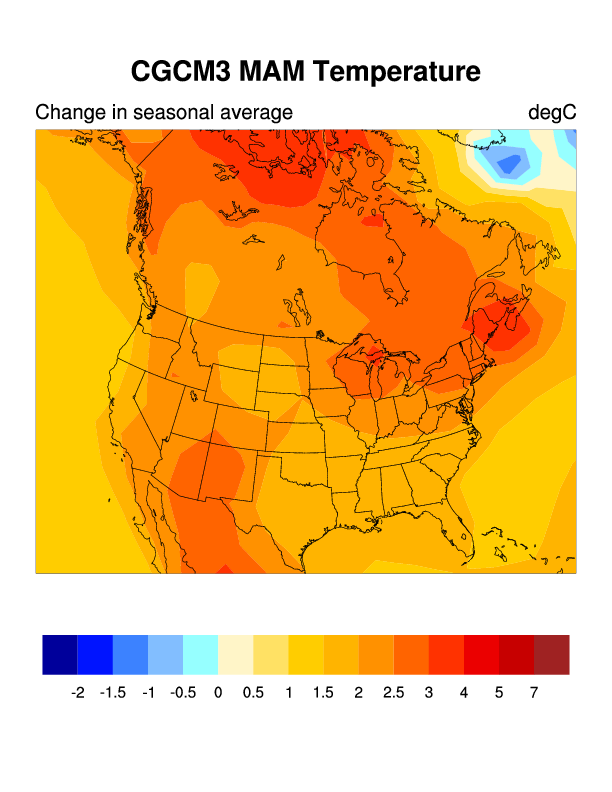
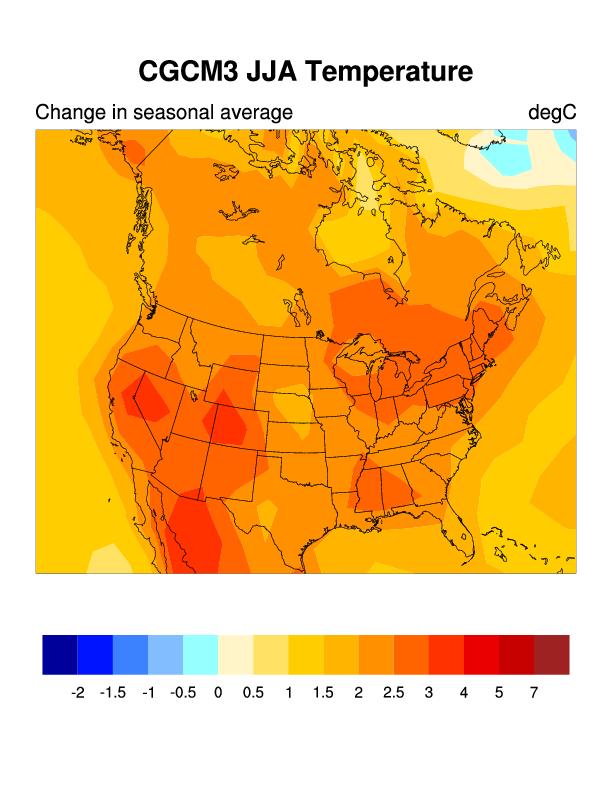
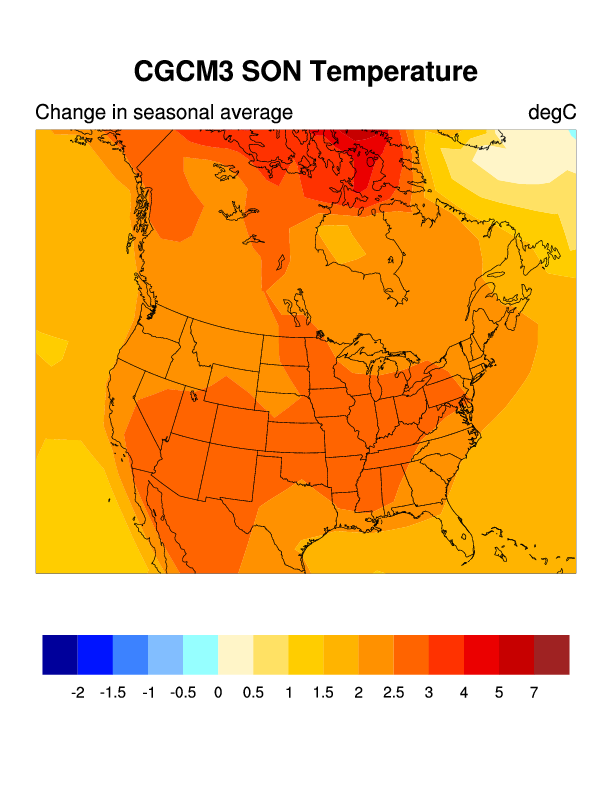
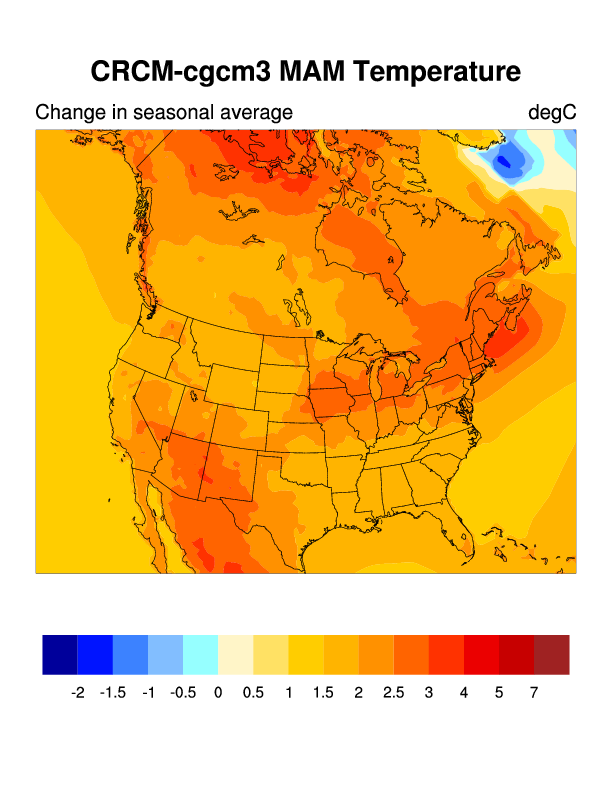
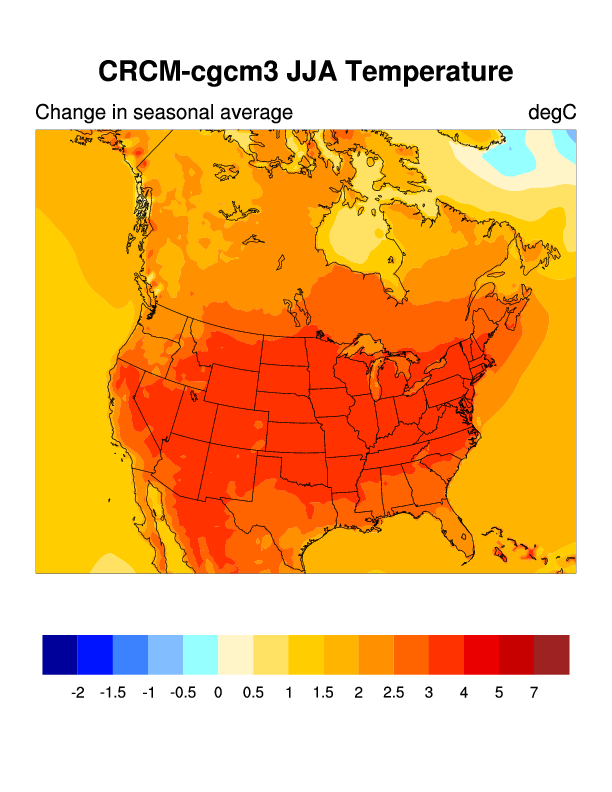
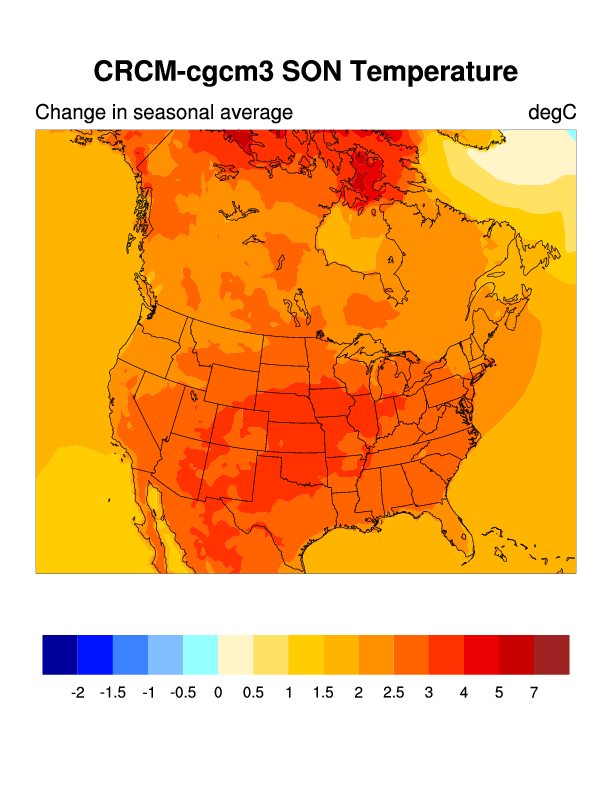
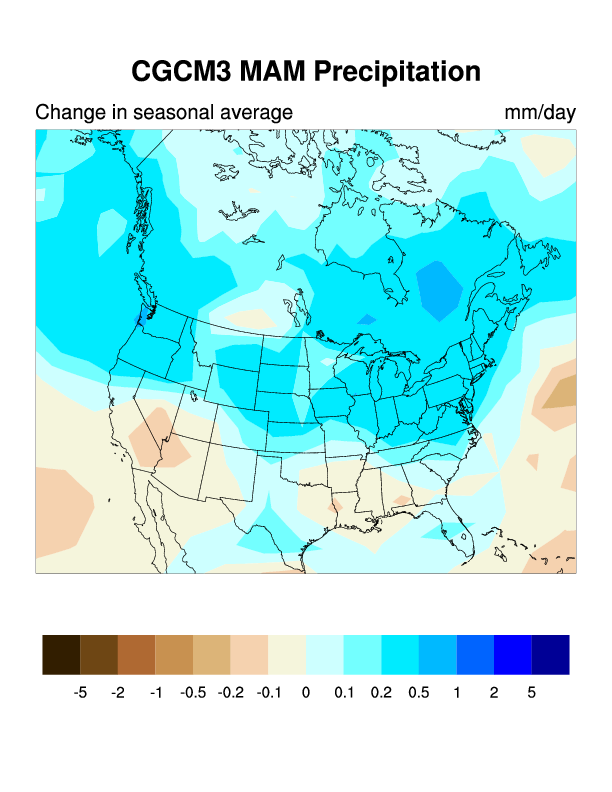
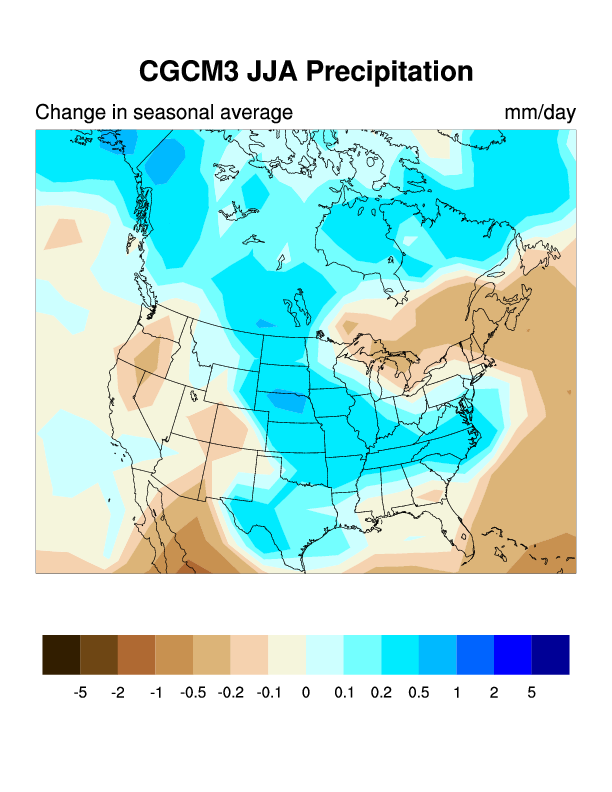
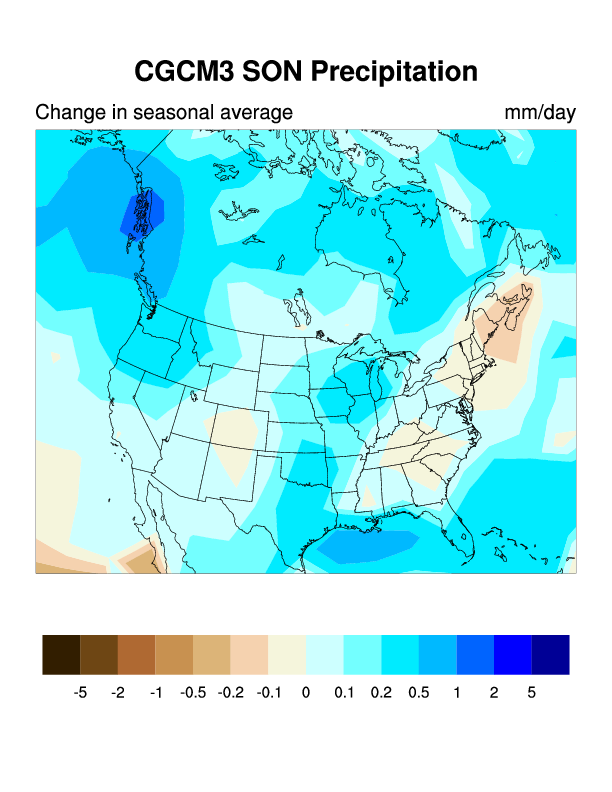
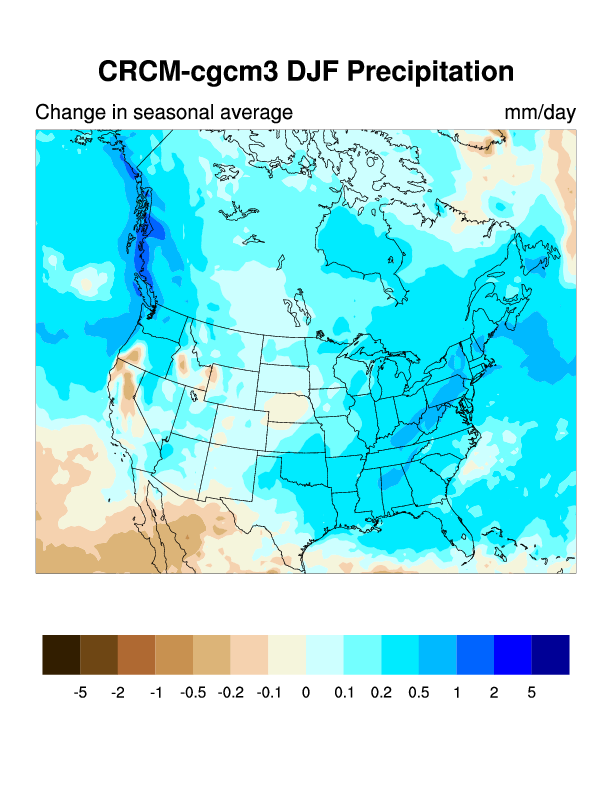
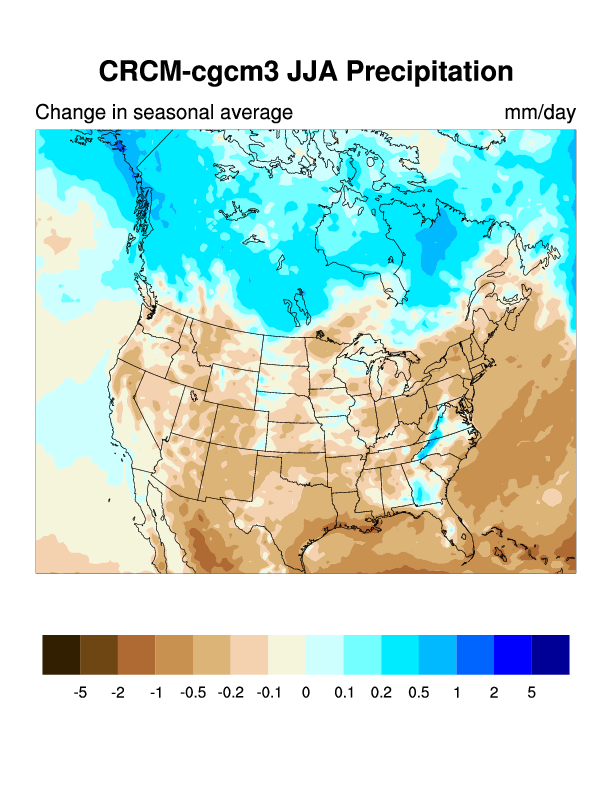
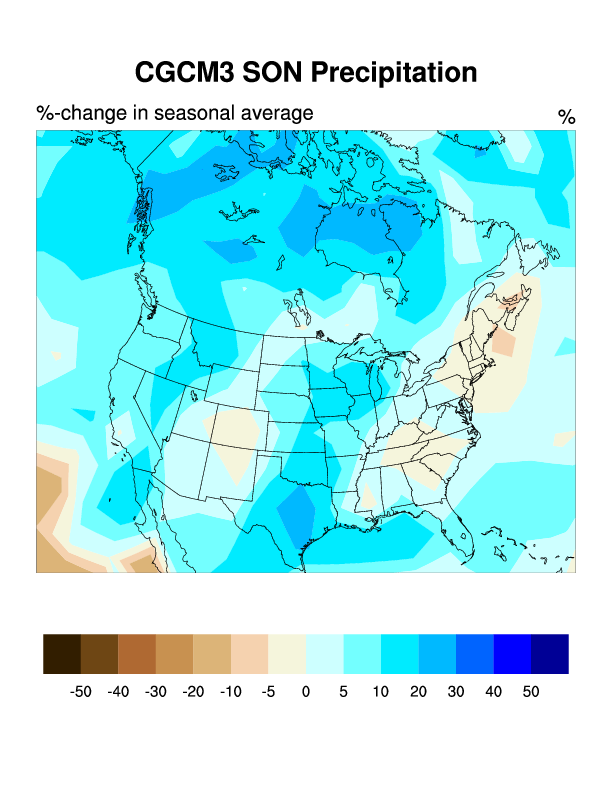
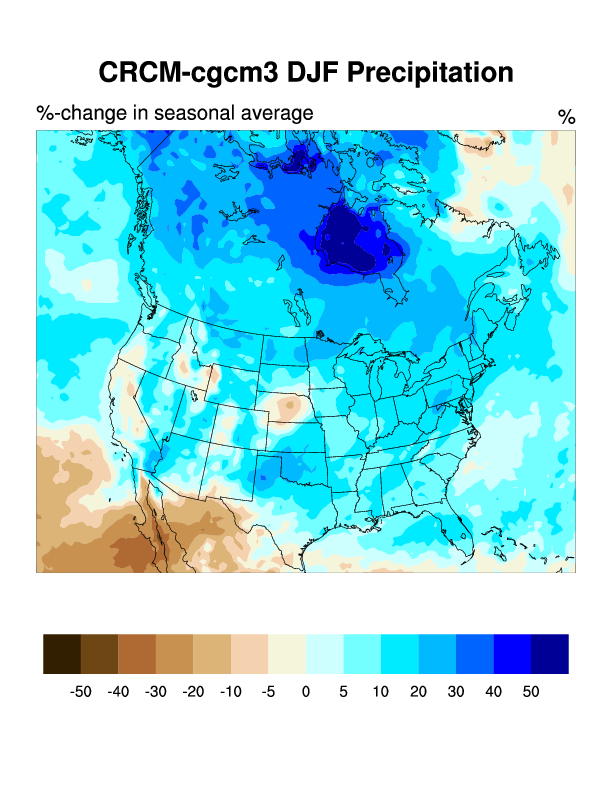
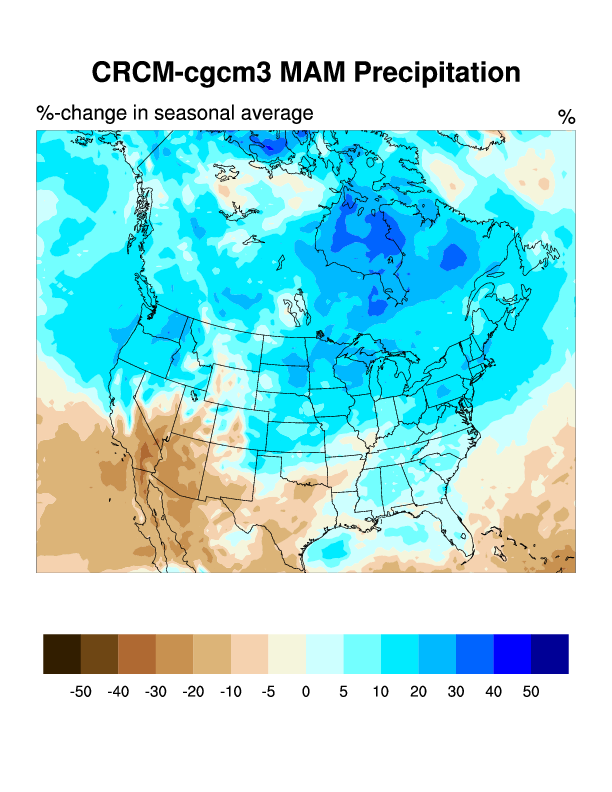
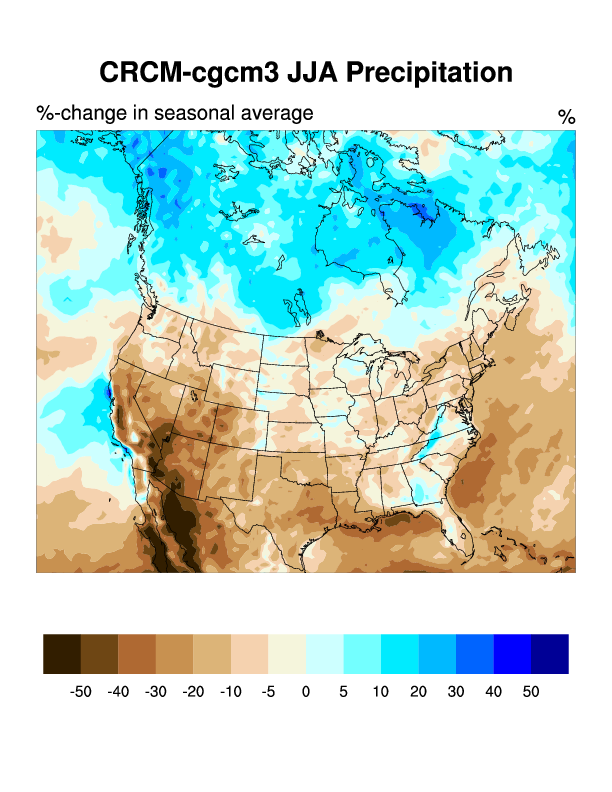
These figures show seasonal average climate change for the periods 2041-2070 minus 1971-2000 for the CGCM3 driving AOGCM and for the CRCM regional model driven with CGCM3 boundary conditions.
For printing: PostScript versions of these plots. |