|
NARCCAP data is CF-compliant, and therefore can be imported directly
into ArcGIS v.9.3 or higher. There are two ways to import NetCDF
data: as a feature layer, or as a raster layer.
Importing NetCDF as Raster
- Download data.
- Start ArcMap.
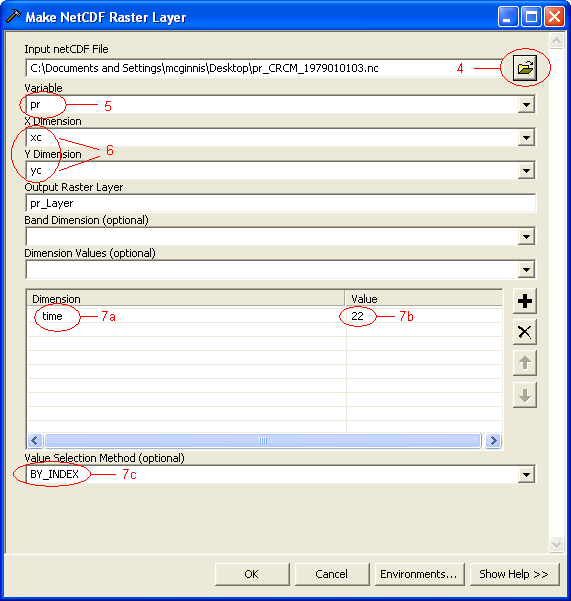
- Under ArcToolbox -> Multidimension Tools, choose "Make NetCDF
Raster Layer".
- A dialog will appear. Select your datafile as the "Input netCDF
File". (Depending on the size of the file, you may now need to wait
some time while ArcMap reads metadata from the file.)
- Select the data variable you're interested in displaying from the
"Variable" drop-down list.
- Leave "X Dimension" and "Y Dimension" with their default values of
"xc" and "yc", respectively.
- Specify the timestep you want to view.
- Choose "time" from the "Dimension Values" dropdown list.
- Click the cell in the "Value" column next to "time" in the
"Dimension" list.
- If the NetCDF file contains fewer than 200 timesteps, you will be
able to select the timestep by value from a dropdown list. Otherwise,
you must enter the index value of the timestep and change the "Value
Selection Method" dropdown to "BY_INDEX".
- Click "OK".
(screenshot)
Importing NetCDF as Feature
- Download data.
- Start ArcMap.
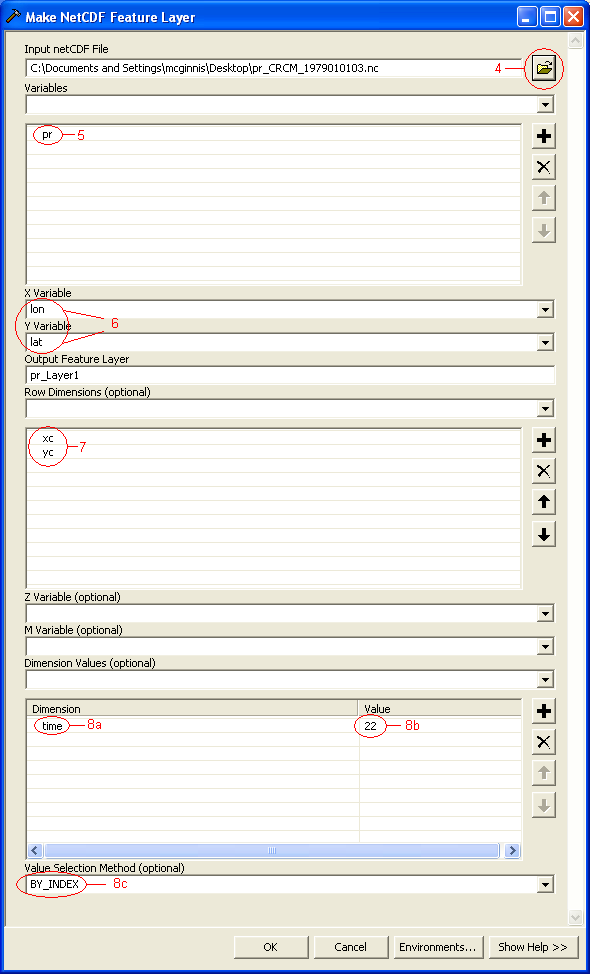
- Under ArcToolbox -> Multidimension Tools, choose "Make NetCDF
Feature Layer".
- A dialog will appear. Select your datafile as the "Input netCDF
File". (Depending on the size of the file, you may now need to wait
some time while ArcMap reads metadata from the file.).
- Select the data variable you want to display using the "Variable"
drop-down list.
- Change the "X Variable" and "Y Variable" to "lon" and "lat",
respectively, using the appropriate drop-downs.
- Add xc and yc under "Row Dimensions".
- Specify the timestep you want to view.
- Choose "time" from the "Dimension Values" dropdown list.
- Click the cell in the "Value" column next to "time" in the
"Dimension" list.
- If the NetCDF file contains fewer than 200 timesteps, you will be
able to select the timestep by value from a dropdown list. Otherwise,
you must enter the index value of the timestep and change the "Value
Selection Method" dropdown to "BY_INDEX".
- Click "OK".
(screenshot)
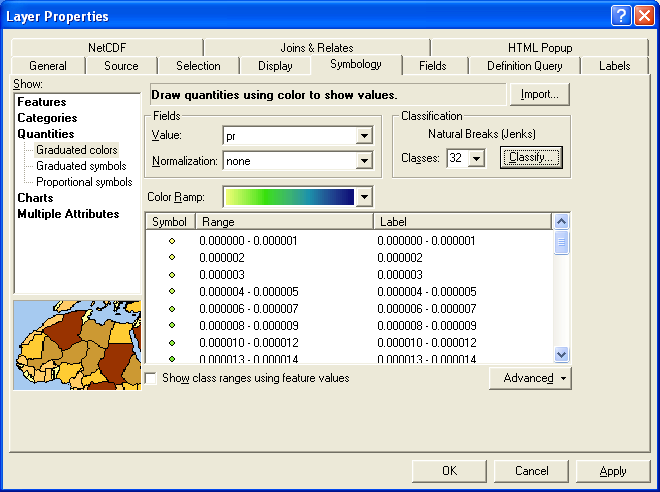
NOTE: By default, each data point is drawn using the same
symbol. To apply a color ramp to the points, right-click the layer
name and choose Properties, click the Symbology tab, and choose
Quantities->Graduated Colors. (screenshot)
More About Selecting a Timestep
Information about the size of the timestep and the starting point
of each file can be found in the headers of the NetCDF file. On
Windows, you can use a program like Panoply to view NetCDF header
information. Specifying the timestep by index is inconvenient, but
necessary if the file contains more than 200 timesteps.
If you need to work extensively with time (subsetting, averaging,
or concatenating the time dimension), you will likely find it easier
and get better performance using other tools
to process the NetCDF files before importing them into GIS. In
particular, the NCO toolkit, when compiled with udunits support,
allows you to work with times and dates instead of index values, and
the CDO toolkit implements a number of important climatological
averages.
If no timestep is specified, ArcGIS will read the
first timestep in the file.
If the file has 200 or fewer timesteps (i.e., if you were able to
select the timestep from a dropdown list), then after the data has
been displayed in ArcMap, you can change the timestep through Layer
Properties:
- Right click on the Layer in the Table of Contents and go to Properties
- Click on the NetCDF tab
- Select a new timestep from the dropdown
- Click OK.
Solving Projection Problems
If you are having problems overlaying the NARCCAP data onto other
datasets, you may have a projection problem. All projection problems
have been fixed in ArcGIS 9.3, but here are some steps you can take to
fix them if you are using an earlier version:
Does your other GIS data has a projection defined?
- In ArcCatalog, navigate to your GIS data.
- Right-click on the data and go to Properties.
- Click the XY Coordinate System tab.
- Make sure the data has a projection defined.
- If not, define the projection.
Can ArcMap read the projection information from your netCDF file?
- Right-click on your data frame and go to Properties.
- Click the Coordinate System tab. (screenshot)
- When you look at your netCDF layer, is the projection "Unknown"? If
so, then you must manually define the projection.
- If you do not know the projection, use a netCDF tool such as ncdump or Panoply to
view the file's headers and get the projection information.
- In the Data Frame -> Coordinate System tab, define the projection.
|


